How much do you know about your heating and cooling products?
Most of us take the comfort solutions in our home for granted. Though experts are on hand to offer assistance when things go wrong, you’ll find that you can get a much more comfortable and reliable home just by learning a little more about the units we often overlook. That’s why we’ve put together a list of our favorite, and most informative infographics you can use to learn more about the HVAC industry and its fun, related facts.
How Your Home Comfort Works
Unless you’re an HVAC expert, the chances are that you don’t know exactly how your heating solutions work. While there’s nothing wrong with a little knowledge gap (that’s what specialists are for), some quick and easy information could be all it takes to make your home more efficient and comfortable. For example:
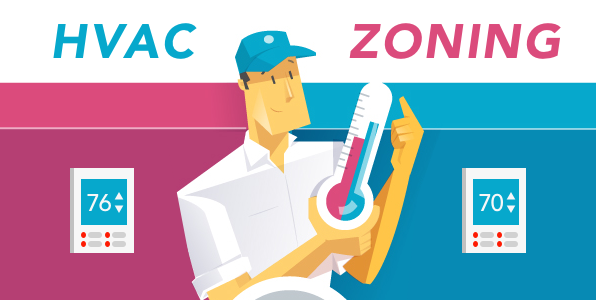
HVAC zoning is a quick and innovative solution for achieving convenience, comfort, and energy efficiency within a property. Though it’s been around for some time now, many homeowners still don’t know exactly what they could achieve by installing a zoning system. This infographic will tell you everything you need to know about the benefits of HVAC zoning, and how you can update your system to allow for a more personalized approach to temperature regulation.
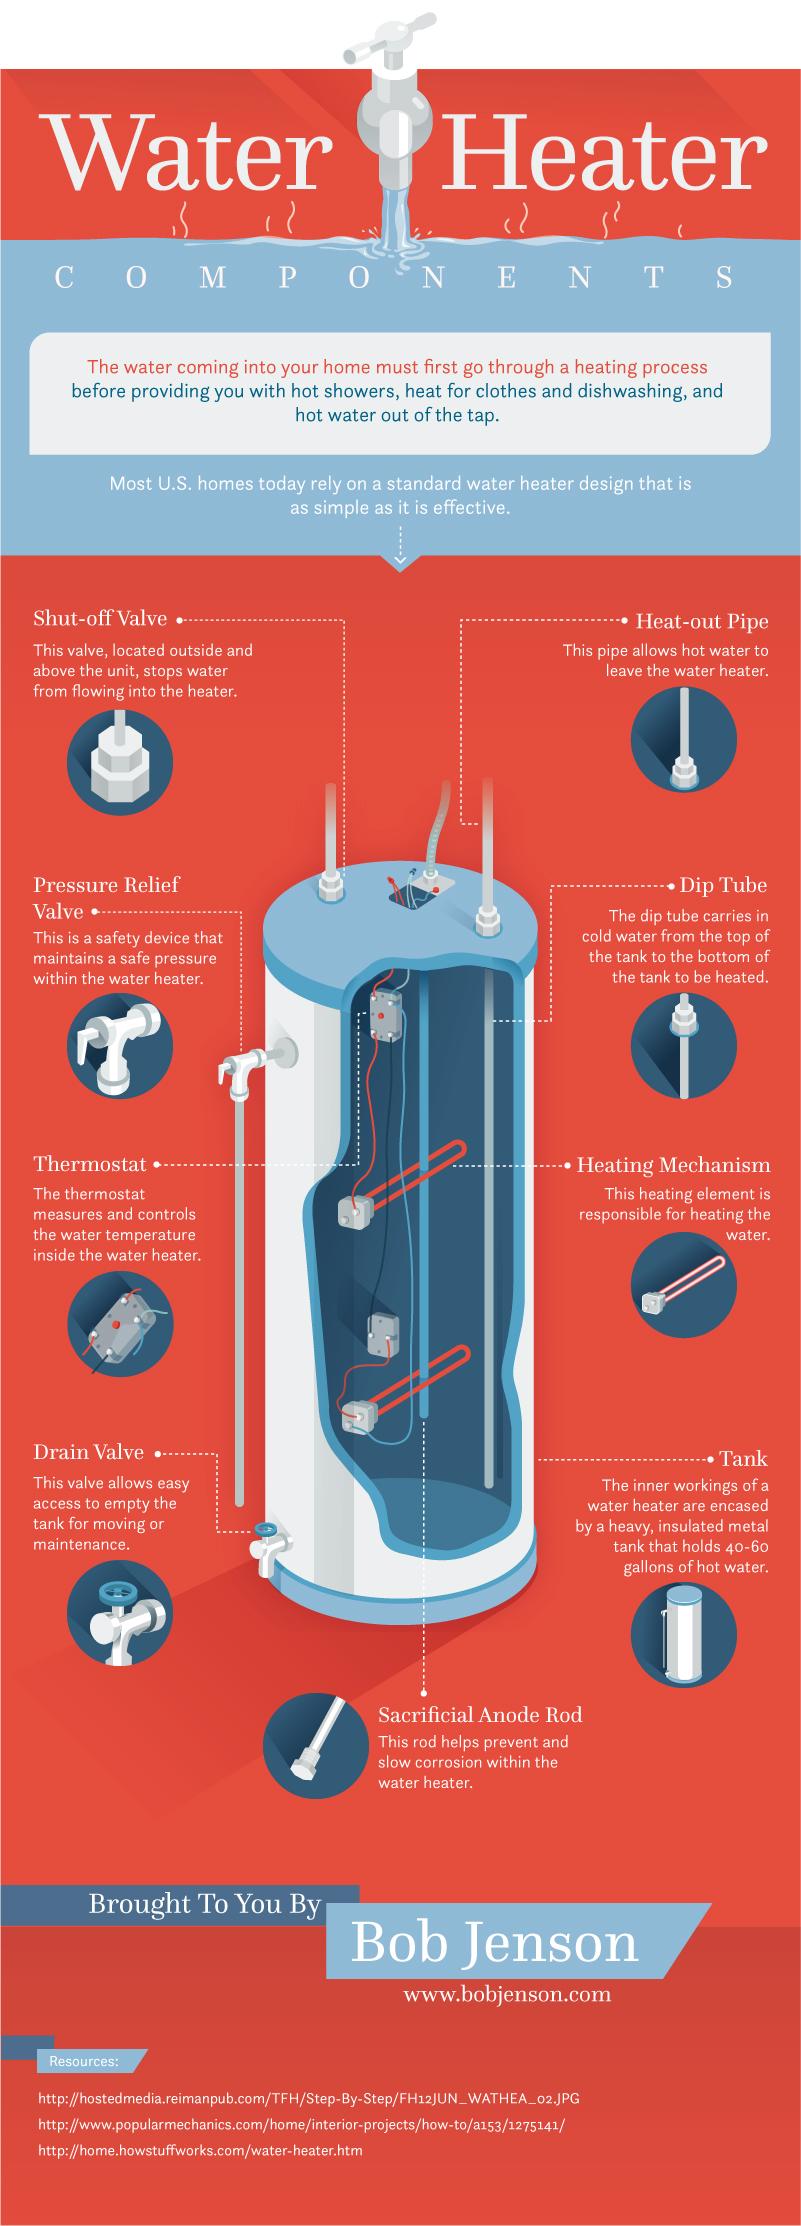
The chances are that the last time you wondered how your water heating system worked, was when it wasn’t working properly. However, it’s important to remember that your water heater is essential to everything from dishwashing, clothes washing, and filling a bath. This infographic will ensure that you’re familiar with all the unique components of a water heater.
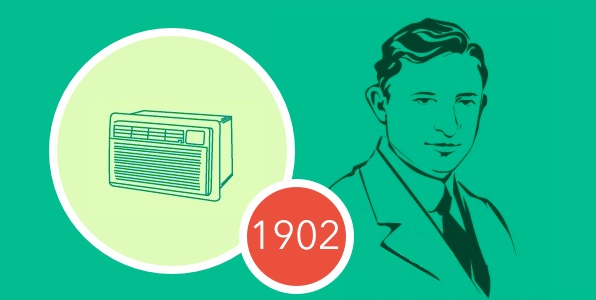
Have you ever wondered about the birth of the air conditioner? These fantastic appliances offer comfort to people across the globe when it comes to managing heat. This infographic will show you how we evolved from a world without access to instant cool air, to a nation of homes in which 86% of people use air conditioning units.
Breathing Easy, and Finding the Ideal Temperature
We all know just how important temperature is to comfort. When we’re too hot or too cold, it’s impossible to feel at ease inside of our own skin. However, did you know that the quality of the air you breathe is also a significant concern in today’s climate? These infographics will not only help you to identify the perfect air temperature but give you an insight into the value of air quality too:
To some degree, the concept of the “perfect” temperature will always be a personal one. You may feel too hot when your loved ones feel cold, or the other way around. However, there are certain temperatures that are more effective at certain times. This infographic will show you what the “perfect” temperature means, and what the most comfortable temperature may be for sleeping or working.
The state of the air we breathe has changed in recent years. As more chemicals and pollutants enter the atmosphere, the air around us is becoming more intoxicated with new and often unhealthy substances. This infographic will help you learn more about the “state of the air” around you, from which cities in the U.S. are the most polluted to which are the cleanest for short-term particle and ozone pollution.
Energy Spending and Energy Saving
Finally, as we universally focus more effort on protecting the environment with cautious energy expenditure, it makes sense that we’d want to understand how we use energy, and how much money we spend generating it for our homes. Why not learn more about how much energy your appliances use, discover the myths of energy saving, and compare your expenses to the average bills by state?
With this infographic, you can find out which states are paying the most, and which are paying the least for their energy. Not only will this help you understand the cost of energy throughout the U.S., but it could help you make sure you’re getting a good deal for your area.
Do you know how much energy you’re using every time you switch on an electric furnace or air conditioner? This infographic will help you calculate your energy usage throughout the home, and could even give you the information you need to save up to 30% on your energy costs!
The more we learn about saving and using energy, the more chance we have of falling victim to the myths that are frequently shared around the internet. This infographic will give you an insight into the common misconceptions that homeowners have when attempting to lower their energy usage.
A Little Knowledge Goes a Long Way
While you don’t need to know everything about the various heating and cooling systems in your home, learning more from time to time can be a great way to understand how the units in your home work. With that information, you can do everything from lower your energy consumption to make sure you’re getting a great deal on your monthly bills!


